Learn which data to track based on your goals by exploring your shop statistics.
In order to develop a successful growth plan, you must first determine how your business is functioning over time. Your shop analytics provide unique information on how visitors find and interact with your listings.
You can look at a lot of information in your shop metrics such as:
- How many orders you’ve received
- Which listings are the most popular
- Which search phrases customers are using to discover you.
The patterns and insights you uncover may influence Everything from product development to advertising budgeting.
Read on for some pointers on how to interpret the data on your shop analytics dashboard.
See How Well Your Store is Doing at a Glance
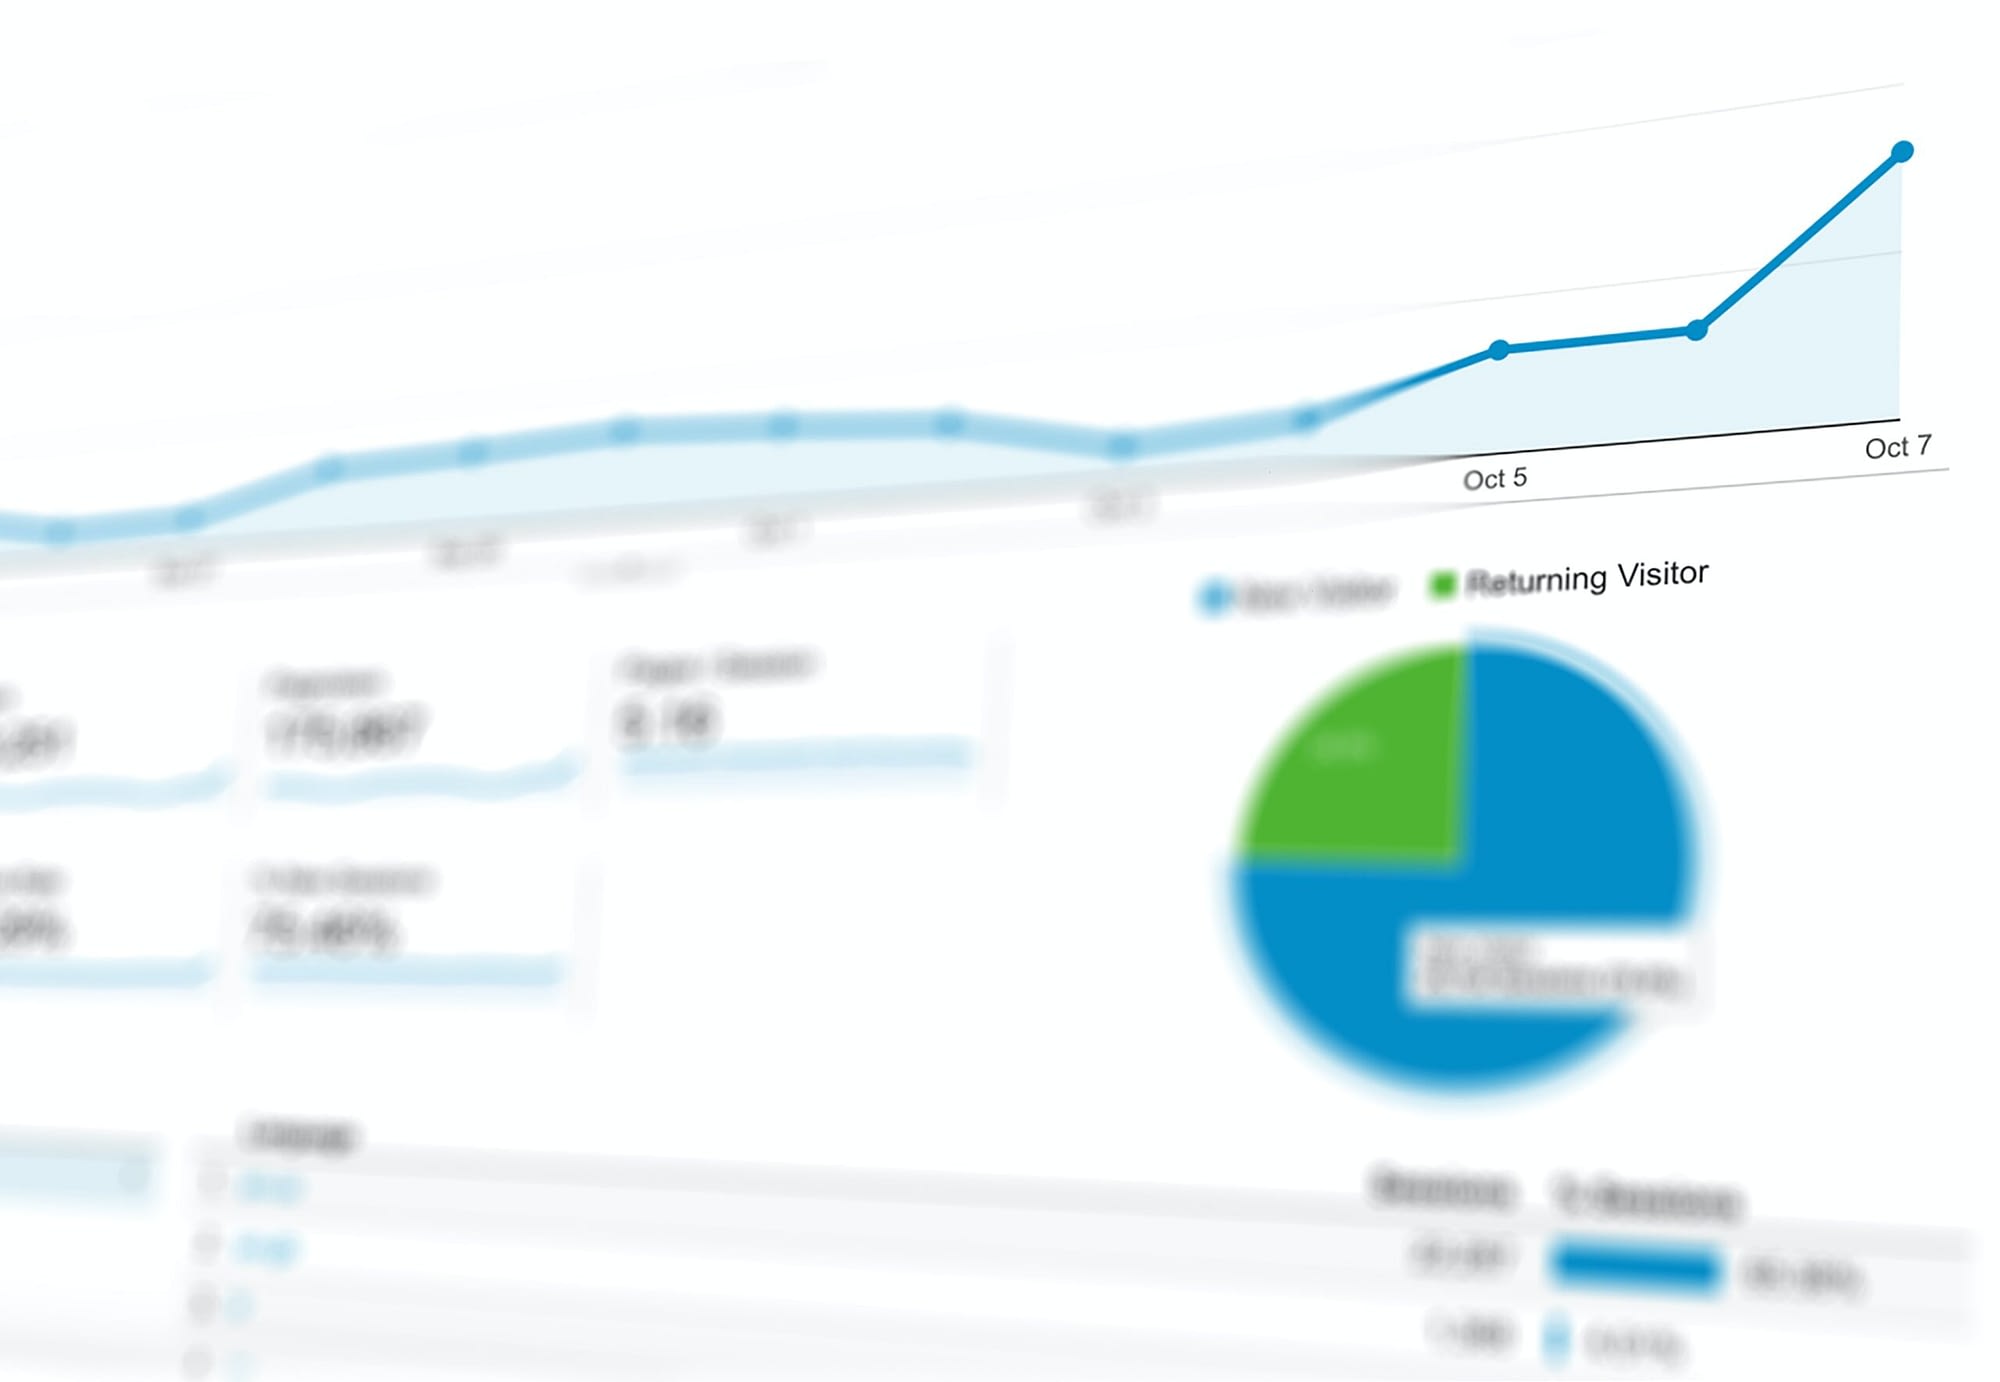
Under Stats in the sidebar of the Store Manager, you can discover your individual shop and listing data. The top overview gives you a quick summary of your shop statistics.
We recommend looking at your visits and orders for at least 30 days. It will enable you to get a better idea of the health of your store. The sales of many stores fluctuate from season to season.
The graph will instantly update to reflect performance throughout the period when you select a time range. This allows you to quickly visualize patterns in visitors, orders, conversion rate, or revenue. The default information in this view is a comparison of store visits. However, you may change that by selecting orders, conversion rate, or revenue to see that information on the graph.
You’ll notice brief insights on performance patterns for the selected time above the chart. The statistics in each area might help you figure out where to go next. It’s vital to think about how different metrics relate to one another.
The ratio of visits to completed orders is your conversion rate. This is why it is an essential statistic connection to keep track of.
Your conversion rate is best assessed over time and may be influenced by a number of things such as:
- Product photography
- Price
- Other factors such as the number of customer reviews and average review rating
Compare your data to the same period last year to put things in perspective. Keep track of all of your big marketing activities, promotions, and paid advertising so you can figure out what’s causing your traffic and revenues to rise. If your conversion rate is higher for the time yet your visits are down, you might concentrate your deeper analytics analysis on any changes in your traffic sources.
While the global average conversion rate for e-commerce sites is 2.9 percent (covering a wide variety of larger online retailers), a “good” conversion rate on Etsy varies substantially across categories and price points. On average, sellers should anticipate a conversion rate of 1–5%. A low conversion rate shouldn’t be a reason for concern while your store is getting up and operating. The more visitors your store receives, the more chances you’ll have to improve your conversion rate.

An In-Depth Look into the Listing-Level Engagement
In shop analytics, your final view shows a variety of performance information for all of your active listings. You’ll notice a total of total listing views for the period here, as well as the average number of listings a consumer views when they come to your store. You can see which listings are most commonly seen and sold, as well as the income produced from each listing over time.
The average number of listings seen per shopper may give you a good idea of how engaged your customers are with your whole shop’s offers, from product selection to overall branding and design.
Consider promoting your most popular listings in your marketing on social media or elsewhere as you assess the success of specific listings. Buyers are drawn to your most popular postings for a reason. That information may be used to convert those visits into sales.
You might want to consider retiring or revamping products with low views or sales so that you can concentrate your efforts on your top performers.
Every shop’s objectives and method of attaining them are distinct. Decide which metrics you’d like to influence, establish numerical objectives, and start testing after you have a feel of how your store is working. Keeping track of your progress by reviewing changes in your metrics every two weeks or so can help you stay on target.
Now that you understand how to make the most of your shop statistics, learn to boost your sales with the article The Best Ways To Increase Etsy Sales


